A rout led by the Dow Jones overnight passed through Asian bourses, pushing benchmark Sensex below 34,000 on Friday. What's the near-term outlook for Indians investors? Is what they see a normal bull market correction, not a crash? Is a bear cycle about to set in? Are the Indian market fundamentals strong enough to reverse the course, and soon enough?
US equities lost nearly 4 percent on Thursday on jitters over a hardening rate regime. The Dow Jones lost more than 1,000 points the second time this week. Asian markets followed suit, with China leading with a loss of around 6 percent. Indian equities surprisingly held out against a bloody rout, though the Sensex slipped below 34,000 levels with a more than 500 point loss. The Nifty is now bracing for a fall below 10,000 if the bears linger on for a few more sessions.
How long will the bear market continue? There can't be specific and certain answers. The doomsday theorists are around with grim forecast of the start of the worst-ever bear cycle.
However, in a sunshine growth market like India, there will be on display a greater force of investor trust that will dispel wildly negative outlook. Because equities continue to be attractive in the Indian context. With real estate stuck in a continued sulk, and with cash deposits becoming hugely unattractive, there's pretty little that Indian investors can do than pump money into stocks.
Turmoil to last
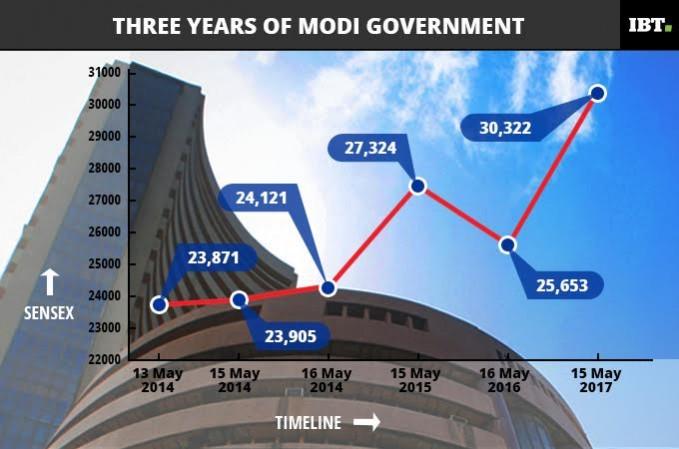
Sensex hit an all time high of 36,000 points and Nifty breached the record 11,000 mark on January 23, 2018. Nine months before that, in April 2017 the benchmark index touched the then record 30,000 mark. So between those two landmarks, investors took home an average of 20 percent returns.
So is it right to say that a market bubble was created by the classic case of the TINA syndrome (There Is No Alternative)? Hard-edged believers won't call this a rout or the popping of a bubble; they would rather call it a healthy correction in a healthy market.
However, the obvious fact is that the benchmark index lost more than six percent in about a week and the bears are in control. Market watchers have said the tumult on the bourses will continue into the next week and then settle down. In between there will be episodes of bottom fishing, which in all probability be followed by sessions of profit-taking.

The staggering bull run in the last six months or so surprisingly coincided with forecasts that suggested India's economic growth is likely to remain stunted this fiscal year. On the other hand, there were concerns that the valuations were looking inflated. Before the current rout in the markets the Price to Earning (P/E) ratio of Sensex stocks was above 26, compared with a little above 21 exactly a year ago. In Nifty the ratio was higher at 27.
A comparison with the P/E ratio of Sensex stocks before the 2008 bloodbath would be interesting. The ratio was at 28.6 in the run up to the market crash at the end of which the index lost 67 percent before bottoming out.
A look at the long-term average P/E ratio for Sensex stocks will place things in better perspective. It's around 17.8, which means the current valuations simply suggest an asset bubble. The ratios in most developed markets is below 20 during a normal cycle.
Bubble in the making
Meanwhile, in India, the ratio of corporate profits to GDP has been much lower than the levels in most advanced economies. India's corporate earnings to GDP ratio fell to 3.5 percent at the peak of the market. For comparison, in the US markets, which logged a similar boom as India, the corporate profits were at a healthier 9 percent of GDP.
When markets outperform the economic fundamentals and corporate profitability, a bubble is in the making. However, some other elements kept sustaining, and driving, the mad rush on the markets. It's probably the TINA syndrome.
The chase of hot returns on the markets in turn generates even more frenetic chase. And then the rush gets wider participation. The rush in the mutual funds segment in recent months was also helped by the wantonly positive media cheerleading and aggressive advertising. The message was loud and clear - There is no alternative.
It seems there's no alternative to a crash as well. The boom-bust cycle is here to stay too. The painful part is getting caught in the tailwinds. Investors might do well to figure out when their cab driver asks for investment tips. And then run to the exit gates.


